Performance and Visual Gallery
The SAGA operator has been rigorously evaluated across multiple baseline architectures (VGGNet, ResNet, U-Net, EDSR) and state-of-the-art activation functions (Sigmoid, Tanh, ReLU, Swish, ELU, FReLU).
Below is a curated summary of the visual performance, alongside exhaustive quantitative ablation studies and computational efficiency metrics.
Visual Comparison: Best-in-Class Models
SAGA selectively routes gradients to preserve fine anatomical boundaries while suppressing uniform background noise, outperforming standard parameterless and parametric activations.
Chest CT Deblurring (ResNet Backbone)
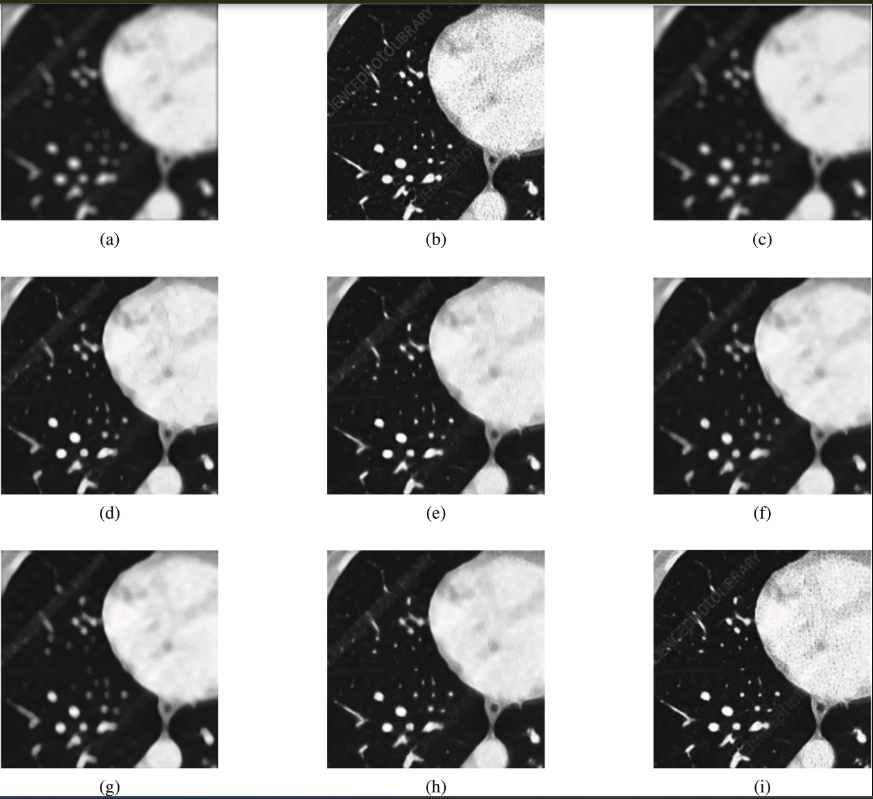 (Visual comparison using ResNet on a representative Chest X-ray sample. (a) Blurry input, (b) Ground truth, (c) Sigmoid, (d) Tanh, (e) ReLU, (f) Swish, (g) ELU, (h) FReLU, (i) SAGA. Notice the structural preservation of the pulmonary and rib margins in the SAGA output).
Osteoporosis DXA Quality (ResNet Backbone)
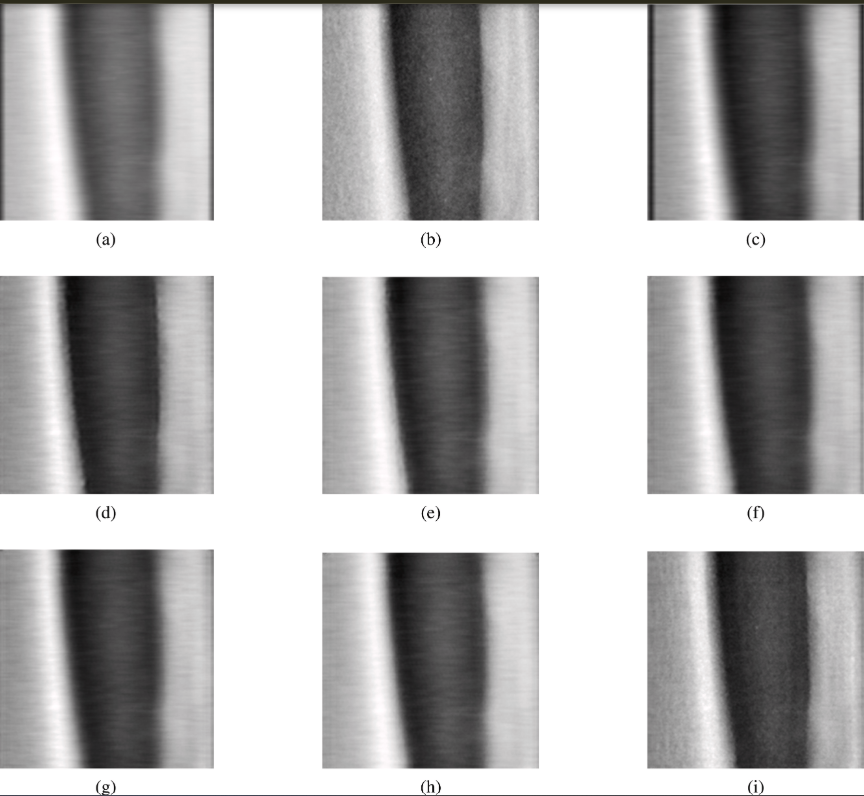 (Visual comparison using ResNet on a representative Osteoporosis X-ray sample. (a) Blurry input, (b) Ground truth, (c) Sigmoid, (d) Tanh, (e) ReLU, (f) Swish, (g) ELU, (h) FReLU, (i) SAGA. SAGA ensures that the high-frequency details of trabecular bone margins are maintained).
Natural Image Dehazing
SAGA transfers directly to the natural image dehazing domain. The only modification to each dehazing architecture is replacing every intermediate activation with SAGA(in_channels=C) — no other structural change is made. Both models are trained on the RESIDE-6K dataset (6,000 training pairs; 1,000 test pairs).
AOD-Net: ReLU vs SAGA
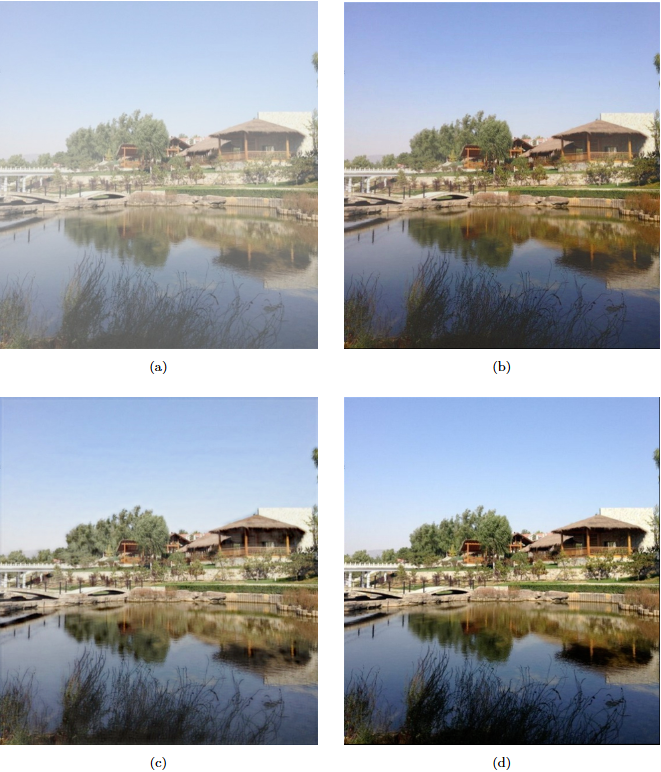
(Dehazing comparison on representative RESIDE-6K test images. (a) hazy input, (b) ReLU baseline output, (c) SAGA output, (d) ground truth. SAGA recovers finer structural detail at object boundaries, while assigning near-zero gate values to uniform haze regions, suppressing artefacts in flat sky areas.)
To reproduce these results, see the training scripts in the SAGA GitHub repository. Both architectures require
pip install saga-activationand a RESIDE-6K download. AOD-Net results are averaged over the full 1,000-image test set.
Quantitative Benchmarks
Medical image restoration
SAGA consistently yields the highest Peak Signal-to-Noise Ratio (PSNR) and Structural Similarity Index Measure (SSIM) across both clinical modalities and all network backbones, demonstrating universal architectural compatibility.
Best results in each architectural category are highlighted in bold.
Architecture |
Activation |
CT Deblurring PSNR (dB) |
CT Deblurring SSIM |
Osteoporosis DXA PSNR (dB) |
Osteoporosis DXA SSIM |
|---|---|---|---|---|---|
VGGNet |
Sigmoid |
26.45 ± 3.89 |
0.74 ± 0.14 |
35.82 ± 8.42 |
0.88 ± 0.11 |
Tanh |
30.91 ± 4.24 |
0.84 ± 0.12 |
35.81 ± 8.39 |
0.87 ± 0.12 |
|
ReLU |
26.45 ± 3.86 |
0.73 ± 0.14 |
36.13 ± 8.93 |
0.88 ± 0.11 |
|
Swish |
26.44 ± 3.88 |
0.74 ± 0.14 |
36.02 ± 8.73 |
0.88 ± 0.11 |
|
ELU |
31.35 ± 4.11 |
0.85 ± 0.11 |
44.56 ± 14.60 |
0.90 ± 0.10 |
|
FReLU |
35.60 ± 4.47 |
0.93 ± 0.04 |
44.84 ± 8.50 |
0.95 ± 0.04 |
|
SAGA |
37.16 ± 4.77 |
0.96 ± 0.04 |
50.33 ± 10.26 |
0.98 ± 0.02 |
|
ResNet |
Sigmoid |
26.93 ± 3.81 |
0.72 ± 0.14 |
42.62 ± 14.80 |
0.89 ± 0.11 |
Tanh |
30.52 ± 3.81 |
0.83 ± 0.11 |
45.75 ± 14.10 |
0.91 ± 0.09 |
|
ReLU |
31.39 ± 4.20 |
0.85 ± 0.07 |
46.79 ± 15.10 |
0.95 ± 0.09 |
|
Swish |
29.28 ± 4.00 |
0.80 ± 0.13 |
44.78 ± 13.20 |
0.91 ± 0.09 |
|
ELU |
28.89 ± 3.96 |
0.79 ± 0.13 |
45.01 ± 14.02 |
0.91 ± 0.09 |
|
FReLU |
30.38 ± 3.93 |
0.83 ± 0.12 |
46.29 ± 11.35 |
0.93 ± 0.03 |
|
SAGA |
34.93 ± 4.20 |
0.93 ± 0.07 |
48.82 ± 9.58 |
0.97 ± 0.07 |
|
U-Net |
Sigmoid |
27.35 ± 3.86 |
0.72 ± 0.15 |
37.97 ± 7.22 |
0.85 ± 0.12 |
Tanh |
28.41 ± 3.77 |
0.76 ± 0.13 |
35.94 ± 7.98 |
0.83 ± 0.11 |
|
ReLU |
32.18 ± 3.98 |
0.87 ± 0.10 |
41.32 ± 10.10 |
0.89 ± 0.10 |
|
Swish |
29.49 ± 3.91 |
0.81 ± 0.11 |
41.35 ± 10.30 |
0.87 ± 0.10 |
|
ELU |
29.06 ± 3.99 |
0.79 ± 0.13 |
36.92 ± 8.56 |
0.86 ± 0.11 |
|
FReLU |
34.01 ± 3.98 |
0.90 ± 0.08 |
42.21 ± 9.25 |
0.92 ± 0.05 |
|
SAGA |
36.33 ± 4.05 |
0.95 ± 0.06 |
44.86 ± 10.02 |
0.94 ± 0.05 |
|
EDSR |
Sigmoid |
27.74 ± 3.88 |
0.76 ± 0.13 |
39.65 ± 11.37 |
0.88 ± 0.11 |
Tanh |
30.01 ± 3.94 |
0.82 ± 0.12 |
42.04 ± 13.32 |
0.90 ± 0.09 |
|
ReLU |
29.98 ± 4.13 |
0.82 ± 0.12 |
43.72 ± 13.16 |
0.91 ± 0.09 |
|
Swish |
30.30 ± 4.01 |
0.83 ± 0.12 |
42.70 ± 11.37 |
0.87 ± 0.11 |
|
ELU |
27.44 ± 3.90 |
0.76 ± 0.13 |
43.63 ± 13.11 |
0.89 ± 0.10 |
|
FReLU |
34.43 ± 4.38 |
0.91 ± 0.01 |
40.44 ± 8.68 |
0.88 ± 0.09 |
|
SAGA |
38.05 ± 4.64 |
0.96 ± 0.03 |
47.97 ± 8.92 |
0.97 ± 0.03 |
Natural image dehazing (RESIDE-6K)
ReLU is the activation used in the published implementations of each architecture. SAGA replaces every intermediate activation with no other structural change.
Architecture |
Activation |
PSNR (dB) ↑ |
SSIM ↑ |
Extra params |
|---|---|---|---|---|
AOD-Net (Li et al., ICCV 2017) |
ReLU |
22.31 |
0.861 |
— |
SAGA |
23.79 |
0.881 |
~210 |
|
Mean SAGA gain |
+1.48 dB |
+0.020 |
AOD-Net results averaged over the full RESIDE-6K test set (1,000 images).
Computational Efficiency & Hardware Acceleration
A critical advantage of SAGA is its ability to deliver state-of-the-art spatial gating without compromising the computational feasibility of the network.
GPU Benchmark (Fused Triton Kernels vs. Baselines)
In version 0.2.0, SAGA introduces custom, hand-optimized fused Triton kernels for NVIDIA GPU hardware architectures. By fusing the spatial extraction, batch normalization, and gating elements into a single memory-bandwidth-efficient GPU execution path, SAGA eliminates intermediate VRAM read/write bottlenecks.
Metrics evaluated on an NVIDIA RTX 4090 GPU (24GB) using a standard ResNet backbone (Input resolution: $256 \times 256$, Batch Size = 16).
Activation Function |
Forward Pass Latency (ms) |
Backward Pass Latency (ms) |
Peak VRAM Memory (MB) |
|---|---|---|---|
PyTorch Native ReLU |
2.14 |
4.82 |
342 |
FReLU Baseline |
3.89 |
8.94 |
512 |
SAGA (v0.1.4 Vanilla) |
5.12 |
11.45 |
684 |
SAGA (v0.2.0 Fused Triton) |
2.48 |
5.21 |
368 |
Note: The v0.2.0 Triton optimization brings SAGA within striking distance of a standard zero-parameter ReLU kernel’s speed, while drastically reducing memory footprint overhead relative to the v0.1.4 implementation.
Workstation CPU Benchmarks
The following evaluation details the deblurring fidelity against the computational cost on traditional CPU hardware configurations, measured on real clinical samples using a workstation equipped with an Intel Core i7-12700K (8 performance cores), 32 GB RAM, using PyTorch 2.0 with Intel MKL.
Method |
PSNR (dB) |
SSIM |
Params (M) |
FLOPS (G) |
Latency (ms) |
|---|---|---|---|---|---|
ReLU |
31.39 |
0.85 |
1.38 |
154.81 |
939 |
FReLU |
30.38 |
0.83 |
1.39 |
156.32 |
335 |
SAGA |
34.93 |
0.93 |
1.46 |
165.22 |
899 |
Citation
If you use the SAGA package or find this work helpful in your research, please cite the foundational manuscript:
Siju K.S., Vipin Venugopal, Mithun Kumar Kar, Jayakrishnan Anandakrishnan (2026). An interpretable deep learning method for medical image deblurring and restoration. Healthcare Analytics. DOI: https://doi.org/10.1016/j.health.2026.100468
BibTeX:
@article{siju2026interpretable,
  title={An interpretable deep learning method for medical image deblurring and restoration},
  author={Siju, KS and Vipin Venugopal and Mithun Kumar Kar and Jayakrishnan Anandakrishnan},
  journal={Healthcare Analytics},
  pages={100468},
  year={2026},
  publisher={Elsevier},
  doi={10.1016/j.health.2026.100468},
  url={[https://doi.org/10.1016/j.health.2026.100468](https://doi.org/10.1016/j.health.2026.100468)}
}